Thanks for checking in to see what’s new for Release 101! Check back in next week for several additional updates you won't want to miss!
GoodData Help is now available! Through a single interface, business users and developers can find answers to their most pressing questions and explore the documentation for individual features. More content is on the way. Please visit and bookmark GoodData Help.
In conjunction with Microsoft’s stated End of Life timeline, GoodData will no longer support Internet Explorer 8 as of April 8, 2014. Customers are encouraged to upgrade to the latest version of Internet Explorer and to remain current with the latest release in the future. See http://support.microsoft.com/lifecycle/.
New updates since release 101:
Release 101.9
Saturday, July 26, 2014
Release 101.8
Saturday, July 19, 2014
Release 101.7
Saturday, July 12, 2014
Release 101.6
Thursday, July 3, 2014
Release 101.5
Saturday, June 28, 2014
Release 101.4
Saturday, June 21, 2014
Release 101.3
Saturday, June 14, 2014
Release 101.2
Saturday, June 7, 2014
Release 101.9
Release 101.9 contains various enhancements and bug fixes to the platform and GoodData Portal. Check back next week for the latest updates!
Release 101.8
Release 101.8 contains various enhancements and bug fixes to the platform and GoodData Portal. Check back next week for the latest updates!
Release 101.7
Polynomial Trendlines in line charts
Line charts now support the use of quadratic and cubic trendlines.
- Quadratic trendlines are the plots of quadratic equations (Ax2 + Bx + C), which describe the path of minimum variance through a set of data points. These trendlines are useful for describing trends in data when there is a single peak or valley.
- Cubic trendlines rely on cubic (Ax3 + Bx2 + Cx + D) equations to describe the path of minimum variance through a set of data points. They are useful for describing data trends that contain multiple peaks and valleys.
Through the Report Editor, trendlines can be added to line charts to describe trends in the reported data using linear and now polynomial regression techniques. In the Show Configuration pane, select the type of trendline to super-impose on your line chart from the Advanced Configuration options.
- For more information on trendlines, see http://help.gooddata.com/doc/public/wh/WHAll/Default.htm#GDRefGuide/GlobalSettings.htm.
Dashboard filters now available in Explorers
You can now apply dashboard filters to your Explorer reports. When you create or edit an new report, select the appropriate filter to include from the Filter menu. Save the Explorer, and the filter is available for users.
NOTE: Explorers are currently in Beta release.

Figure: Dashboard filter added to a Scatter Explorer
- For more information on Scatter Explorers, see http://help.gooddata.com/doc/public/wh/WHAll/Default.htm#GDRefGuide/ConfiguringScatterExplorers.htm.
- For more information on dashboard filters, see http://help.gooddata.com/doc/public/wh/WHAll/Default.htm#GDRefGuide/FilterMenu.htm.
Dashboard export to PDF uses consistent page breaks and other export fixes
NOTE: This update is currently in Beta release. It can be enabled through the Feature Flags App. See https://secure.gooddata.com/labs/apps/feature_flags/index.html.
When a dashboard is exported to PDF format from the GoodData Portal, page breaks are now consistent with the dotted lines displayed in the Portal. Additional fixes:
- For some versions of Chrome, content could be missing.
- Some exports rendered empty pages or blank reports.
- .PNG images were not displayed in dashboard exports.
- Web-based content was shrunk in exported dashboards.
- The right side of boxed content was not displayed in exported dashboards.
- Reports containing scrollbars could result in improperly positioned images.
The above issues have been fixed.
Release 101.6
Release 101.6 contains various enhancements and bug fixes to the platform and GoodData Portal. Check back next week for the latest updates!
Release 101.5
Agile Data Warehousing Service Is Now Available
The Agile Data Warehousing Service (Data Warehouse) provides secure, high-speed storage in the cloud without volume limits. Built on top of Vertica, a leading-edge columnar database, Data Warehouse can store enterprise data directly from all of your source systems, enabling you to manage snapshots of your data as close to the source as possible. After data has been captured into Data Warehouse, you can use standard SQL tools and methods to perform within the database any manipulations required of your ETL processes. In-database modifications greatly accelerate the overall process, turning ETL into ELT. When you are ready to load your project, a simple process extracts the data from Data Warehouse and loads it into the designated project in the GoodData platform.
NOTE:To obtain access to Data Warehouse, please contact GoodData Account Management.
- Some customers may know this feature as Data Storage Service.
- For more information on Data Warehouse, see http://www.gooddata.com/bi-software/platform#platform-store.
- For Data Warehouse documentation, see http://help.gooddata.com/doc/public/wh/WHAll/Default.htm#ADSUG/GettingStartedwithADS.htm.
- For a brief tutorial, see https://developer.gooddata.com/article/agile-data-warehousing-service-tutorial-for-beginners.
Release 101.4
MAQL (Multi-dimensional Analytical Query Language) Enhancements
By default, any data filter applied to a dashboard or report is also applied to any metric contained in it. Additionally, metrics that contain other metrics (parent metrics) have their filters applied to the child metric, too.
In some cases, you may wish to change this default behavior. The MAQL Enhancements for filters enable metric builders to control or remove the filters from the metric that have been applied from parent objects. For example, adding the clause WITHOUT PARENT FILTER to your metric removes all dashboard, report, and metric filters created in parent objects from being applied to your metric. For more information, see http://help.gooddata.com/doc/public/wh/WHAll/Default.htm#MAQLRefGuide/OverridingReportFilters.htm.
- By default, data filters are applied to raw data, before any metric computation is performed. To apply filtration after the metric has been aggregated, the MAQL Enhancements for filters include the HAVING clause. See http://help.gooddata.com/doc/public/wh/WHAll/Default.htm#MAQLRefGuide/HAVINGFilter.htm.
Search for entities in the CloudConnect LDM Modeler
In the LDM Modeler, you can now search the currently displayed data model file for specific entities. Click the search icon (![]() ) in the toolbar and begin typing your search term.
) in the toolbar and begin typing your search term.
- You may also press
CTRL/COMMAND+F.
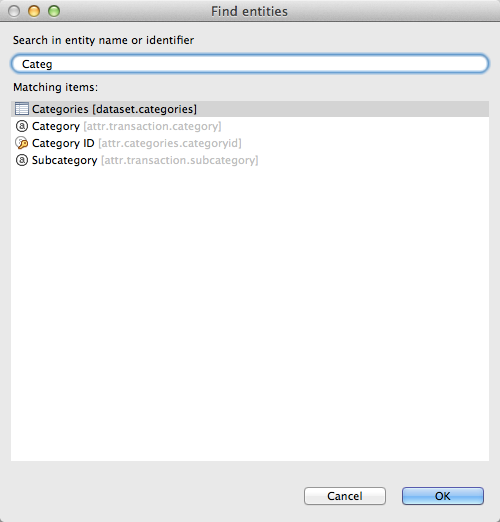
Figure: Searching for LDM Modeler entities
The LDM Modeler begins displaying matches as you type.
- Search terms are matched against the display name or internal identifier of the model entities in the model file.
- The currently displayed *.ldm model file is searched. Model files loaded in other tabs are not searched.
Double-click an item in the search results to select the item in the displayed data model file.
Effective user of a scheduled process is now displayed in Data Integration Console
NOTE: Data Integration Console was formerly known as Data Integration Service Console (DISC).
In the Schedule Details pane, the Data Integration Console now displays the name of the user under which a scheduled process executes. This information can be useful in determining who created the schedule.
- The owner of the schedule may differ from the owner of the process, since processes can be downloaded and redeployed at any time. For example, if a process created by User A is redeployed by User B, all schedules associated with the process are now owned by User B, who will be the user under which all schedules for the process are henceforth executed.
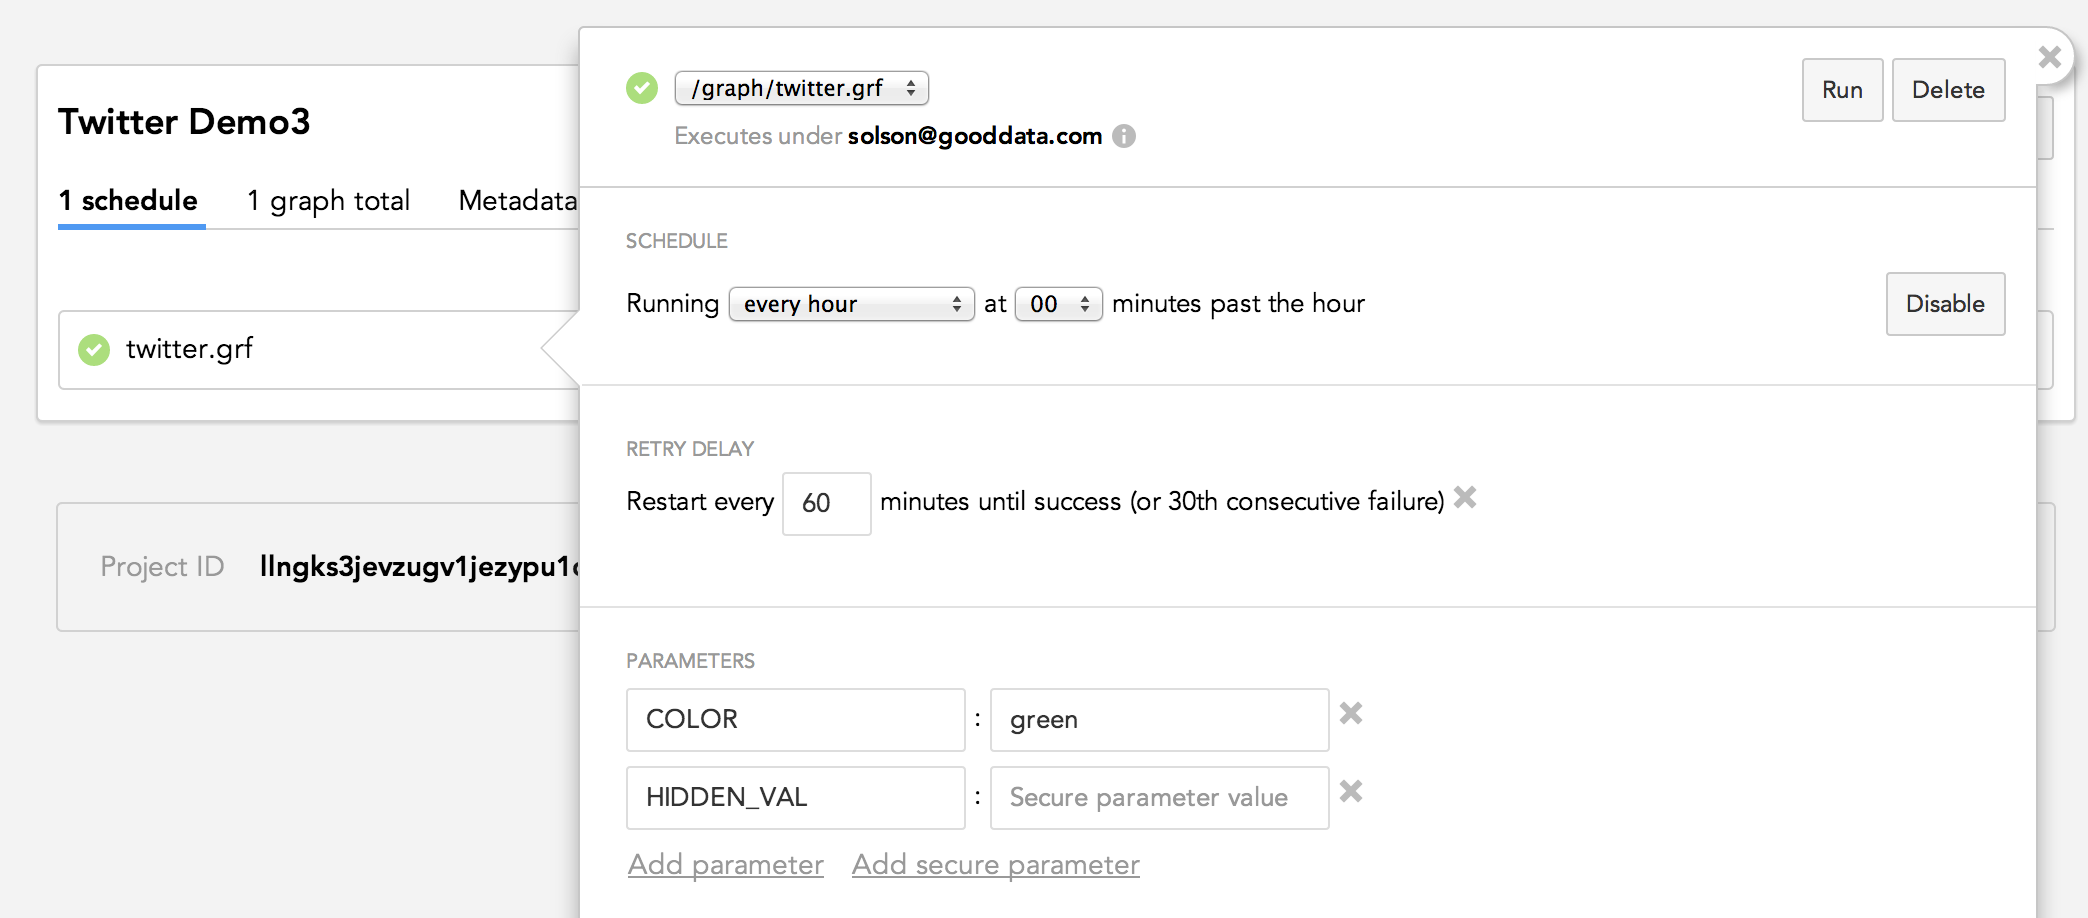
Figure: Username of the user under which the process is executed
For more information, see http://help.gooddata.com/doc/public/wh/WHAll/Default.htm#DISConsoleUserManual/DISC-ScheduleDetails.htm.
Table cells can now be copied
You may now copy content from one or more cells in a table report. Click to select a single cell, or click and drag to select multiple cells in your table report. Then, use the standard keyboard shortcuts (CTRL+C or CMD+C) to copy the cells to the clipboard.
- You may copy table cell data from the Report Editor or from any dashboard where the table report appears.
- You cannot copy column or row headers.
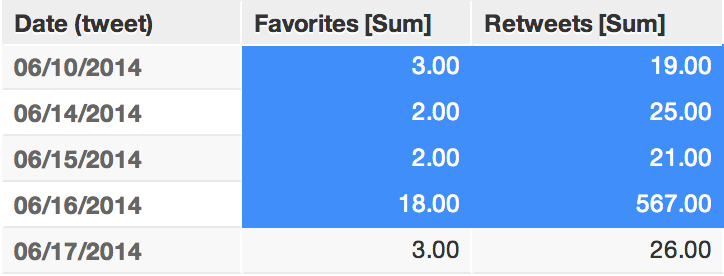
Figure: Click and drag to select cells in a table report
When pasted, cell data appears as tab-separated text.
Release 101.3
Custom Notifications API now supports specifying HTTP headers
The GoodData platform supports the custom notifications delivered via REST API. These notifications can be used to inform other applications of GoodData platform events.
Starting in this release, the platform supports specification of HTTP headers for these custom notifications, which may be required in some environments, as part of the specification of a notification channel. For example, you can now define the Content-Type header value, which instructs the system consuming the notification of the format of the delivered notification and may be required by some third-party APIs.
- For more information, see https://developer.gooddata.com/article/setting-up-the-notifications-using-api.
What's New: Release 101.2
Demo projects integrated into CloudConnect Designer
Through the Welcome page in CloudConnect Designer, you can now download example projects and install them into your local workspace. These example projects have been designed to demonstrate specific capabilities of CloudConnect Designer or the GoodData platform in general, so novice users can learn how to quickly assemble GoodData projects.
- To visit the Welcome page in CloudConnect, select Help > Welcome from the CloudConnect menu. Links to project pages are available in the Examples pane.
- These projects can be reviewed and accessed through the Developer Portal. See http://developer.gooddata.com/article/cloudconnect-example-projects.
New running total functions available in the Simple Metric Editor
Through the Simple Metric Editor in the GoodData Portal, you can now build metrics using the following running total functions:
RUNSTDEV- Running standard deviationRUNSTDEVP- Running standard deviation for populationsRUNVAR- Running varianceRUNVARP- Running variance for populations

Figure: Running total functions in the Simple Metric Editor
Running total functions are used to compute values based on the running totals as of the current date value or other attribute value. For example, you can compute the running standard deviation (RUNSTDEV) of monthly performance for all sales reps for each month of the year in your report.
- For more information, see RUNSTDEV/RUNVAR.
- For more information on standard deviation, see Standard Deviation functions.
- For more information on variance, see Variance functions.
What's New: Release 101.1
Introducing the Data Integration Console
The Data Integration Console enables project administrators, developers, and IT personnel to configure schedules for the automated execution of CloudConnect processes loaded to the platform. Through a simple web interface, you can configure schedules and notifications based on the successful or failed execution of those schedules.
NOTE: Data Integration Console was formerly known as Data Integration Service Console (DISC).
- In addition to many new features, Data Integration Console introduces a new visual style and navigation method.
- The Data Integration Console supersedes the Data Loading Administration Console, which will be available for 3 months. See “Migration Plan” below.
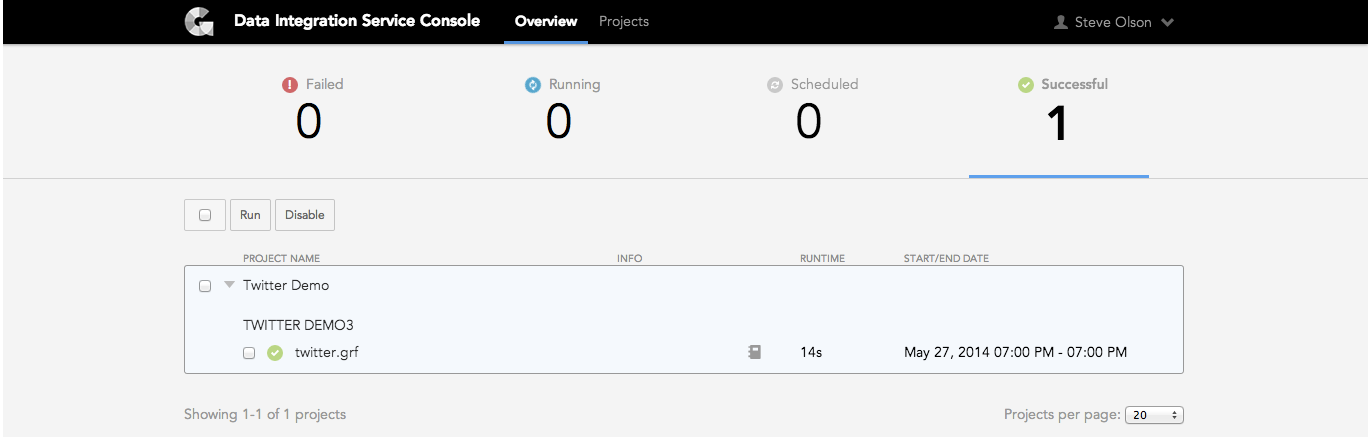
Figure: Data Integration Console homepage
New Features:
- Data loading processes are now categorized by GoodData project.
- Users may also:
- Perform bulk operations on projects and processes for mass process deployment.
- Review and manage processes by project.
- Deploy, re-deploy, and download processes directly from the console.
- Bookmark the new homepage to monitor all data loading processes for all of your projects.
Migration Plan
NOTE: The Data Integration Console replaces the Data Loading Administration Console. The Data Loading Administration Console will continue to be available for 3 months, after which it will be disabled.
After you login, the Data Integration Console is accessible. If you are a project administrator for the current project, select Data Integration Console from the username menu.
It is also available directly from the following URL:
https://secure.gooddata.com/admin/disc/
NOTE: The final backslash in the URL is required.
The earlier console is available at the following URL for the next 3 months:
https://secure.gooddata.com/admin/dataload/
NOTE: The final backslash in the URL is required.
Documentation
For additional details on the Data Integration Console, see Feature - Introducing Data Integration Console.
- For documentation, see Data Integration Console User Manual.
Raw data export factors in report filters
Through the GoodData Portal, you can export raw data in CSV format when it exceeds the display limits imposed by the Portal. Previously, the raw data as specified by the metrics and attributes in the report were exported without regard to any filtering applied to the report. Now, raw data export applies any filters applied to the report.
- For more information, see http://help.gooddata.com/doc/public/wh/WHAll/Default.htm#GDRefGuide/ReportInfoPanel.htm.
Selecting a bar in Interactive report now works
In previous releases of Interactive reports, when you selected a bar in the bar chart, the detail table disappeared. This issue has been fixed.
What's New: Release 101.0
CloudConnect Designer has been upgraded to Eclipse 4 framework
To support the underlying codebase, CloudConnect Designer has been upgraded to use the Eclipse 4 framework.
NOTE: All new features for the ETL Designer and LDM Modeler will be applied to Eclipse 4 builds of CloudConnect Designer. Upgrading now is highly recommended, although this upgrade is not mandatory at this time. All current components are backward-compatible for the time being.
NOTE: This version of CloudConnect Designer cannot be upgraded through the application. You must download and re-install the application from the Developer Portal. Additional instructions are provided below.

Figure: New CloudConnect desktop
New Features:
- New look: New visual design emphasizes better use of whitespace and de-emphasizes non-selected items.
- Improved layout flexibility: Stack application views and editors in the GUI, or pair them side-by-side for easy management of content.
- For more information on Eclipse 4, see http://download.eclipse.org/e4/sdk/drops/R-4.0-201007271520/eclipse-news.html.
Upgrading CloudConnect Designer to Eclipse 4 version
Steps:
- Before you begin, you may wish to backup your CloudConnect workspaces.
NOTE: Please verify that your CloudConnect workspaces are not located inside your CloudConnect application directory.
- Download the CloudConnect distribution for your operating system. See https://developer.gooddata.com/cloudconnect/registration.php.
- Unzip the installation package.
- You may install the new package side-by-side with your existing installation or as a replacement:
- If you wish to replace the old version with the new one, follow the methods for your operating system to remove the old version.
- If you wish to install side-by-side, rename the folder containing the new package. For example, replace
CloudConnectas the folder name withCloudConnect-2.
- Start the new application.
- Configure the application to use your existing workspace. You may create a new workspace location if desired.
- You will need to log in to the GoodData platform again.
New HTTP 503 Status message distinguishes platform maintenance lock from platform error
The GoodData platform now issues a proper HTTP 503 status code message, which indicates that the platform has been locked for maintenance.
- Previously, the platform failed to return a response or performed an HTTP 302 redirect to an error message, which was misleading.
The message returned in the body of the HTTP 503 response is the following:
Scheduled maintenance in progress. Please try again later.
Scheduled maintenance windows are published in the Announcements area of the Support Portal. To receive email updates on scheduled windows, please subscribe to the following area: https://support.gooddata.com/forums/46714-Announcements.
Easier usage of time macros
In MAQL, the curly-braced references to time-based macros ({Previous}) have been superseded by the corresponding keywords (PREVIOUS). This change is made to normalize syntax in MAQL.
NOTE: The legacy time macro references will continue to be supported for a period of time. You should make these changes in your metrics when you can.
To apply the changes, you just need to replace the old time macro reference with the new keyword:
| Old time macro reference | New time macro keyword |
|---|---|
{This} |
THIS |
{Previous} |
PREVIOUS |
{Next} |
NEXT |
For more information, see MAQL Reference Guide.
On the Horizon
GoodData is committed to rolling out new, innovative features. Here's what we've been hard at work on:
- For more information, see Upcoming Features.
Thanks for reading up on the latest updates to the GoodData platform. Check back soon for new features to be unveiled in the weeks ahead!