The Analytical Designer is a new environment for flexible data discovery and visualization design that empowers business analysts to be more self-sufficient and productive when they create visualizations in GoodData. The Analytical Designer leverages the collective intelligence of GoodData’s cloud platform customers to present recommended best practices that help analysts glean insights from their data.
The Analytical Designer empowers you to explore your project data to ensure that you understand what data is available for analysis.
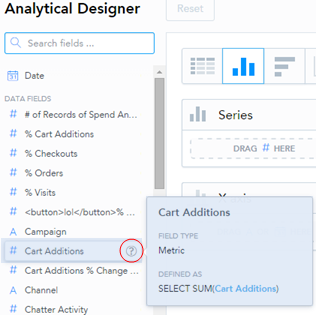
To begin analysis, drag a data field onto the canvas . . .
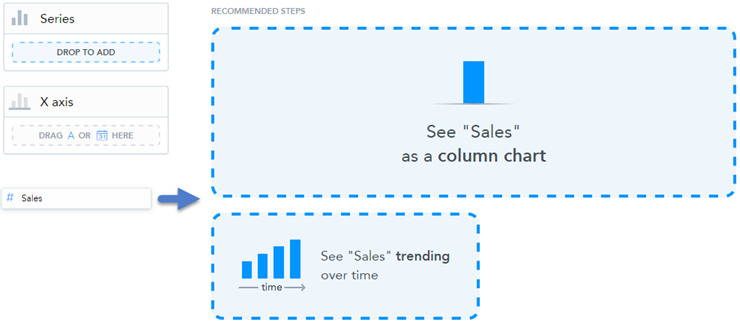
. . . and watch a visualization appear before your eyes.
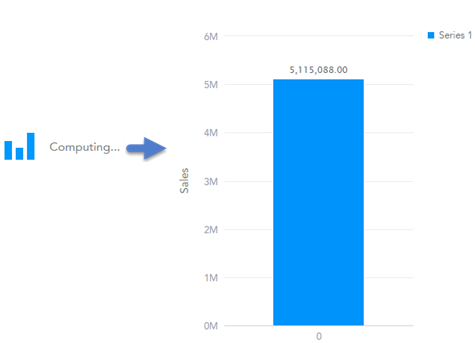
Intelligent drop zones allow you to create the right visualizations in seconds.
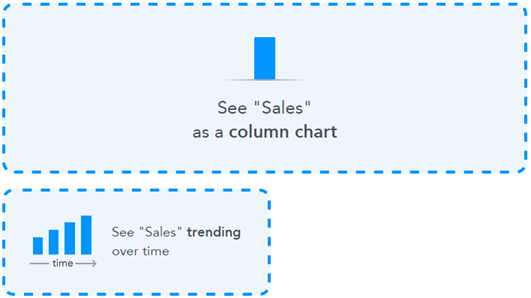
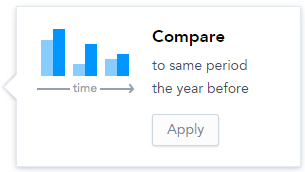
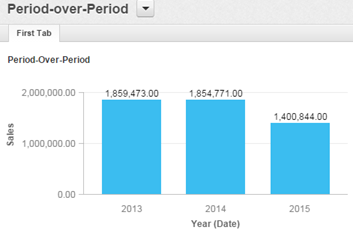
You can define the right visualization with a single click by applying one of the Analytical Designer's best practice recommendations. For example, you can create a sophisticated period-over-period report with a single click.
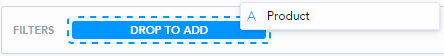
Zero in on the right data with drag and drop attribute and date filters.
You can save your new visualization as a report, modify it in the Report Editor, and then insert it into an existing dashboard.
The Analytical Designer will be available to new customers as part of a special limited release beginning Thursday, January 22nd. Ready to learn more? Please contact GoodData Account Management.
Updates
Rick Segura
Very interesting. I look forward to getting my hands on the new interface.
Emerson Silverio
How can I get or access the analytical designer?
Holly Szkoropad
Hi Emerson,
I'm not able to find you in our records, but if you're a direct customer of GoodData, your account manager will be able to provide you with more information about how to get access. If you aren't sure if you're a customer or have other questions, feel free to reach out to us at support@gooddata.com.